Understanding … PMI suppliers' delivery times: A widely used indicator of supply delays, capacity constraints and price pressures

The suppliers' delivery times index from IHS Markit's PMI business surveys captures the extent of supply chain delays in an economy, which in turn acts as a useful barometer of capacity constraints. The index therefore helps gauge the degree to which the current demand/supply environment is indicative of either a buyers'- or sellers'-market, and hence provides valuable information on developing inflation trends.
How is it calculated?
Purchasing managers participating in IHS Markit's PMI business surveys, conducted in 44 countries, are asked if it is taking their suppliers more or less time to provide inputs to their factories on average. The precise question wording is:
"Are your suppliers' delivery times slower, faster or unchanged on average than one month ago?"
Companies are also asked to provide a reason for any change, if known.
The percentage of companies reporting an improvement, deterioration or no change in delivery times are weighted to derive a 'diffusion index' as follows.
INDEX = (percentage of survey panel responding 'Faster') + (percentage responding 'Same'*0.5)
Hence readings of 50 indicate no change in delivery times on the prior month, readings above 50 indicate that delivery times have improved (become shorter, or faster) and readings below 50 indicate that delivery times have deteriorated (become longer, or slower).
The index is also seasonally adjusted to strip out normal variations in delivery performance for the time of year (we use the widely-used US Census Bureau X-12 ARIMA software for removing seasonality).
In each country, the panel of companies is carefully selected to accurately represent the true structure of the chosen sector of the economy as determined by official data. The survey panels therefore replicate in miniature the structure of the sector being monitored. A weighting system is also incorporated into the survey database that weights each response according to the size of sector in which a company operates, and by its workforce size.
The seasonally adjusted global manufacturing PMI suppliers' delivery times index is shown in chart 1.
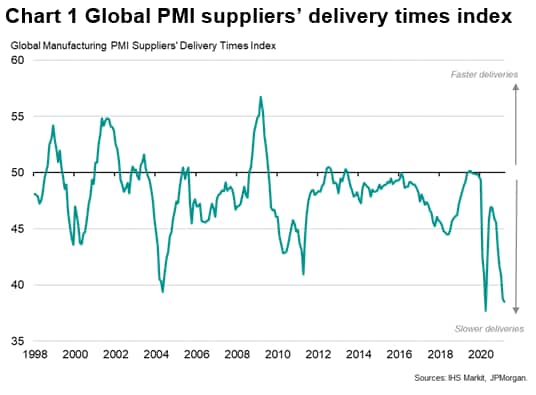
Note that the suppliers' delivery times question is only asked in the manufacturing and construction sector PMI surveys, and is excluded from the services PMI surveys due to the low number of service providers that rely on bought-in inputs of raw materials in their principal business functions.
What does it tell us?
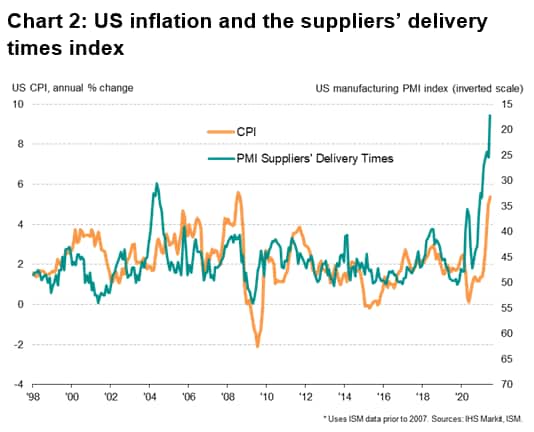
The suppliers' delivery times index became widely watched in the 1990s by high-profile users such as US Fed Chair Alan Greenspan, who cited the index (produced at the time by the NAPM - now known as the ISM) as his preferred leading indicator of inflation.
"Want to know how Federal Reserve Chairman tells if inflation is going to get worse? Forget all those government numbers and the latest murmuring from bond traders. Just look to see if it's taking longer for manufacturers to get supplies delivered.
"Mr Greenspan, speaking in congressional testimony, said that suppliers' deliveries are "far more relevant than the Fed's own capacity utilization figures at gauging price pressures in the economy"
Wall Street Journal, 6 April 1996
The relationship between supplier delivery times and inflation is illustrated in chart 2. Note that in this chart the suppliers' delivery times index has been inverted (done simply by deducting the index value from 100) to more easily see how supply delays are associated with rising prices, and vice versa.
To investigate the relationship further, chart 3 demonstrates how periods of faster global manufacturing production growth typically lead to stretched supplier delivery times and vice versa. Note that in this chart the suppliers' delivery times index has again been inverted.
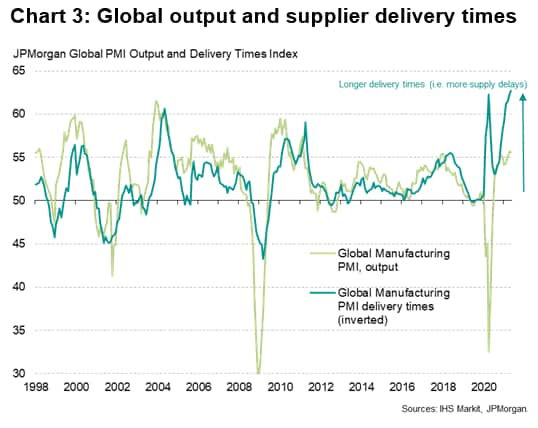
The delivery times index therefore illustrates when supply issues are becoming more widespread as suppliers struggle to meet demand for inputs from factories. At such times, suppliers tend to have greater pricing power, causing manufacturers' input prices to rise.
Conversely, at times of falling demand and falling production, manufacturers cut back on their input purchases, often leaving suppliers with excess unsold stock. At such times, suppliers are more likely to offer discounts, driving manufacturers' input costs lower.
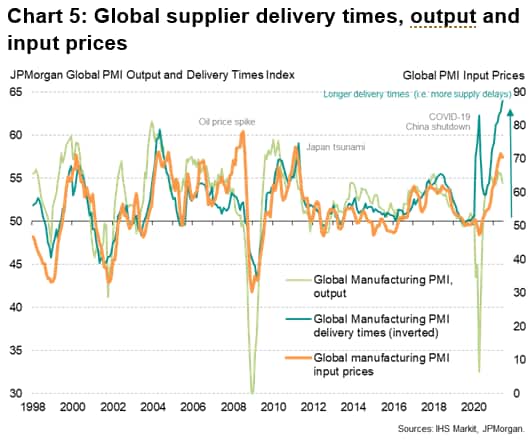
In chart 4, we overlay the global suppliers' delivery times index with the manufacturing PMI input prices index to illustrate this link between supply chain tightness and inflationary pressures.
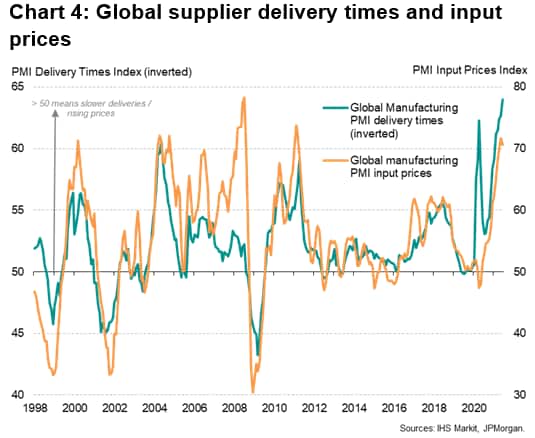
Hence, a simple rule is that when output grows at a rate which is sufficiently strong to cause a widespread lengthening of supplier delivery times, production costs will tend to rise as suppliers hike their prices, and vice versa.
The delivery times index can therefore be considered as a gauge of the extent to which supply and demand are in equilibrium, and the impact any imbalance may have on future prices.
There are some periods which prove to be exceptions, but these exceptions can also provide very useful indications of the business environment and inflation.
Most recently, for example, at the height of the initial COVID-19 pandemic, China closed its factories and shipping, leading to an unprecedented (at the time) lengthening of global supply chains. However, prices did not rise as this supply shock was accompanied by a simultaneous collapse in demand. During other supply shocks, such as the Japanese earthquake- tsunami-related supply shortages of 2011, global prices did spike higher as global demand was expanding at the time.
Back in 2008, a sharp spike in manufacturing prices led to heightened inflation worries at many of the world's major central banks, but the PMI data clearly demonstrated that this price spike was accompanied by neither strengthening manufacturing production growth nor widespread supply shortages. As such, the data hinted strongly that the rise in prices was principally driven by speculative rather than fundamental factors, leaving prices prone to a fall (which is precisely what happened as the global financial crisis subsequently took hold).
How can it be used?
Monitoring the health of manufacturing
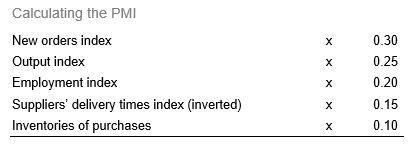
Perhaps the most common application of the suppliers' delivery times index is in its inclusion in the headline manufacturing "PMI", which is a composite indicator based on five survey variables designed to provide a single-figure overview of the health of the manufacturing economy. Chart 6 plots the global PMI and its five components, with the accompanying table showing the corresponding weights for each component.
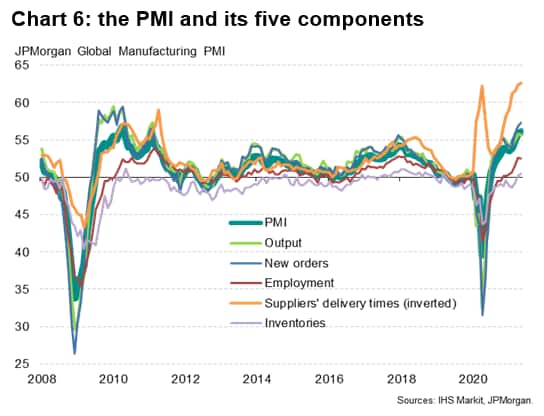
Note, however, that there may be times - such as the pandemic supply shock of 2020 - when the suppliers' delivery times index can distort the signal from the PMI ( read more in our note from May 2020), hence we stress the need to also watch the sub-indices.
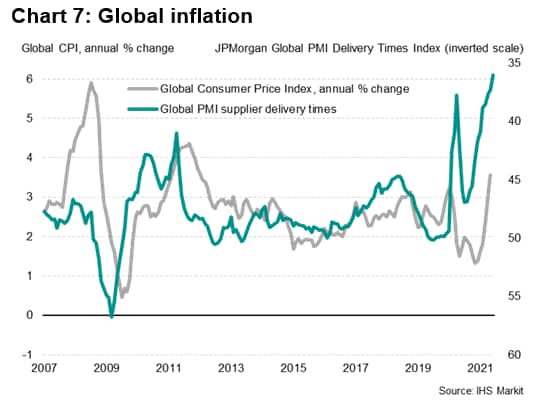
Global inflation trends
As chart 1 illustrated, a further principal use is in gauging the extent of any inflationary pressures that are being caused by demand exceeding supply. The international comparability of the PMI also means global or other regional comparisons can be easily obtained, as shown by chart 7, which tracks the global PMI delivery times index against global CPI inflation.
International comparisons
Because the PMI surveys use the same methodologies around the world, the delivery times index can be easily used to make direct comparisons of supply chain pressures both by country and by sector.
Chart 8 ranks some of the countries covered by IHS Markit's PMIs by their suppliers' delivery times index readings in June 2021.
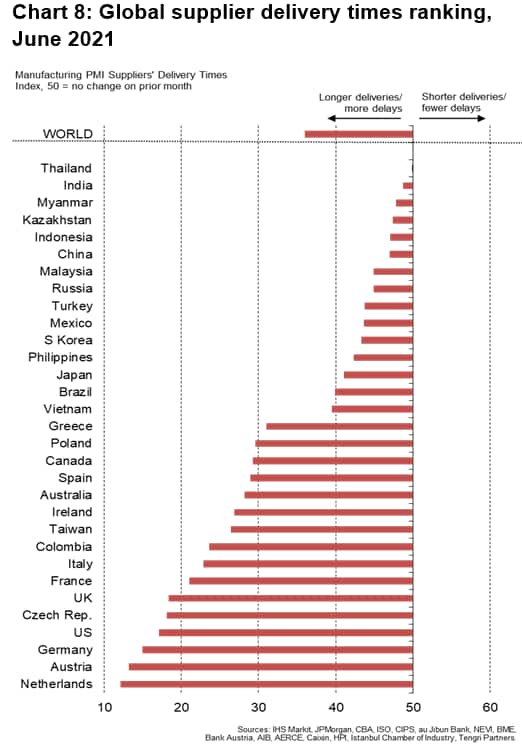
The chart reveals that the most widespread reporting of delays was seen in the Netherlands, followed by Austria and Germany. The fewest delays were seen in Thailand and India.
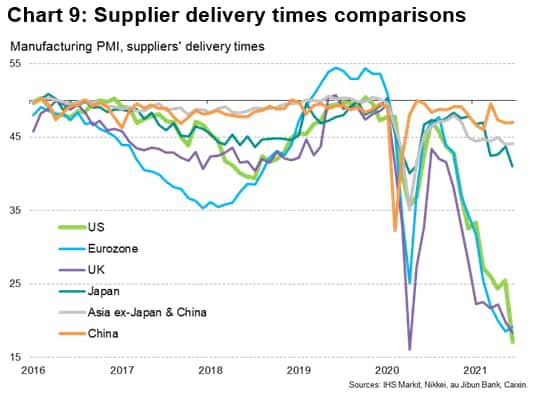
In fact, the rankings underscore how the record incidence of supply chain delays seen globally during the second quarter of 2021 were largely confined to Europe and the United States, with Asia being far less affected by supply delays. This divergence is shown in chart 9, which uses some aggregated country PMI data.
Global sector comparisons
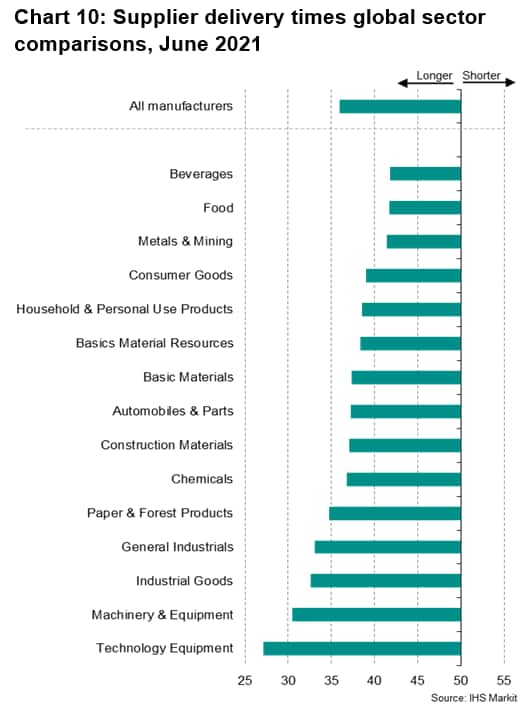
Similarly, sector variations in delivery performance trends can be readily analysed to ascertain where supply constraints have been the most/least widespread. Chart 10 shows the suppliers' delivery times index for the major manufacturing sectors globally in June 2021. The greatest supply chain delays were recorded in the tech equipment sector followed by other machinery & equipment manufacturers.
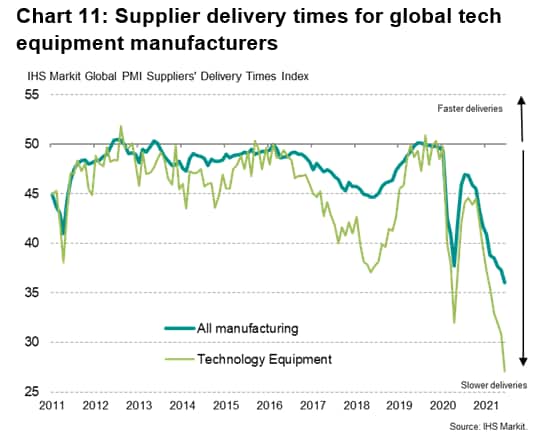
Time series data for each sector can easily be analysed, including benchmarking sector performance against global 'all sector' averages (e.g. see chart 11), with regional splits also available for Europe and Asia.
Monetary policy signals
Given that the delivery times index can act as a useful barometer of inflationary pressures, it can also provide helpful insights into monetary policy trends. Central banks are eager to assess underlying price trends by seeking to estimate the 'output gap' or other similar concepts around capacity utilisation. The suppliers' delivery times index therefore provides policymakers with a single-figure proxy of industrial capacity utilisation.
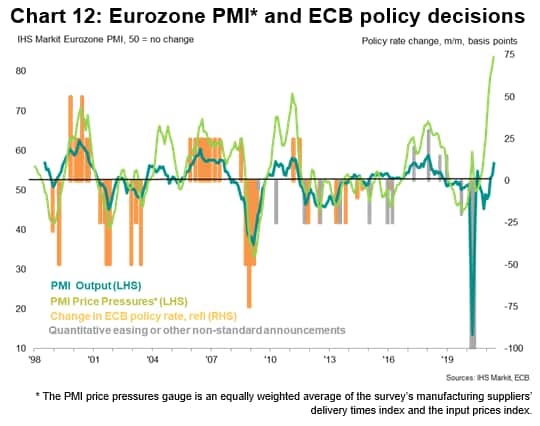
Combining the suppliers' delivery times index with the PMI's input price gauge goes one step further, producing a monthly estimate of these supply-side constraints and the pass-through to firms' costs. Labelled the 'price pressures' index in chart 12, this gauge from the eurozone PMI is tracked against historical policy changes by the ECB's Governing Council, and helps to explain many of the ECB's policy decisions.
Related indicators
Output
The volume of units produced this month compared with the situation one month ago (based on respondent's definition).
New Orders
The level of new orders received (in units, not money) this month compared with the situation one month ago. Domestic and export orders are included in this definition.
New Export Orders
The level of new orders received which will require shipment across the national border (in units, not money) this month compared with the situation one month ago.
Backlogs of Work
The level of unfinished sales orders, i.e. sales orders not yet started or not yet completed (in units, not money) this month compared with the situation one month ago.
Quantity of Purchases
The volume or number of items purchased this month compared with the situation one month ago.
Stocks of Purchases
The level of inventory of materials purchased (in units, not money) this month compared with the situation one month ago.
Stocks of Finished Goods
The level of finished product which has come off the production line and is awaiting shipment/sales (in units, not money) this month compared with the situation one month ago.
Employment
The level of full-time employment this month compared with the situation one month ago. For the purpose of calculation it is agreed that two part time employees should be treated as one full time employee. Seasonal hiring of employees is excluded in this definition.
Input Prices
Average prices of all goods purchased (volume weighted) this month compared with the situation one month ago.
Output Prices
Average selling prices of all goods produced (volume weighted) this month compared with the situation one month ago.
Future Output
Whether output levels will be higher, the same or lower than current levels in 12 months' time.
Chris Williamson, Chief Business Economist, IHS Markit
Tel: +44 207 260 2329
chris.williamson@ihsmarkit.com
© 2021, IHS Markit Inc. All rights reserved. Reproduction in whole
or in part without permission is prohibited.
Purchasing Managers' Index™ (PMI™) data are compiled by IHS Markit for more than 40 economies worldwide. The monthly data are derived from surveys of senior executives at private sector companies, and are available only via subscription. The PMI dataset features a headline number, which indicates the overall health of an economy, and sub-indices, which provide insights into other key economic drivers such as GDP, inflation, exports, capacity utilization, employment and inventories. The PMI data are used by financial and corporate professionals to better understand where economies and markets are headed, and to uncover opportunities.
This article was published by S&P Global Market Intelligence and not by S&P Global Ratings, which is a separately managed division of S&P Global.