November flash US PMI signals solid GDP and jobs growth

- IHS Markit PMI data signal GDP growth rate of 2.5% in fourth quarter
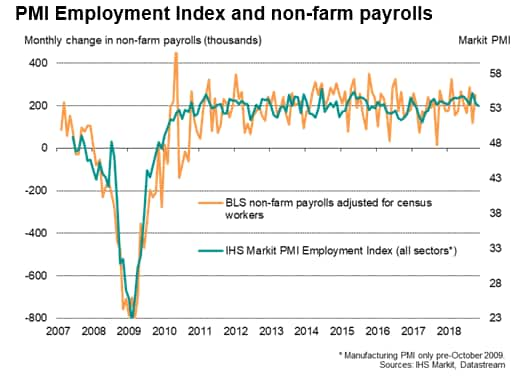
- Jobs growth of 185k indicated alongside steady upward price pressures
The November flash IHS Markit PMI surveys brought further evidence that the US economy is enjoying a strong fourth quarter, showing resilience in the face of a wider global slowdown and escalating trade war worries.
At 54.4, the flash estimate of the IHS Markit U.S. Composite PMI™ Output Index fell from 54.9 in October, but remained at a sufficiently elevated level to indicate that the economy is continuing to grow at a robust pace.
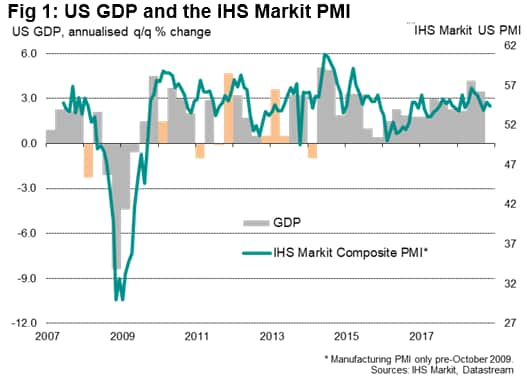
Comparisons with official data suggest that the average PMI reading for the fourth quarter so far is indicative of GDP rising at an annualised rate of 2.5% (see below). Such solid growth is all the more impressive when taken in the context of the 4.2% and 3.5% rates of expansions seen in the second and third quarters respectively, which had already signalled the best back-to-back quarterly performances of the US economy since 2014.
While an easing in employment growth was evident from the flash PMI composite jobs index during the month, the overall level of the index likewise remained elevated by historical standards, suggesting that further robust hiring persisted into November. The PMI's Employment Index has exhibited a 95% correlation with monthly non-farm payroll changes over the past decade, highlighting the accuracy of the survey model in terms of its job growth estimates. The November flash reading is indicative of a 185,000 non-farm payroll rise.
Simple GDP nowcasting using the PMI
Monthly PMI values can be used to accurately predict quarterly GDP growth rates in advance. To highlight this 'nowcasting' value of the PMI, a simple OLS regression is used where the PMI output index (covering both manufacturing and services) is the sole variable used to explain the official GDP growth rate. However, as Fig 1 below shows, GDP have in the past tended to suffer from undue volatility, mainly in the first quarters of each year between 2008 and 2014, thought to be due to the official data not fully capturing seasonal influences (depicted by orange bars). The PMI should not be expected to predict such errors and the inclusion of such 'outliers' would only distort the model and resultant GDP estimates.
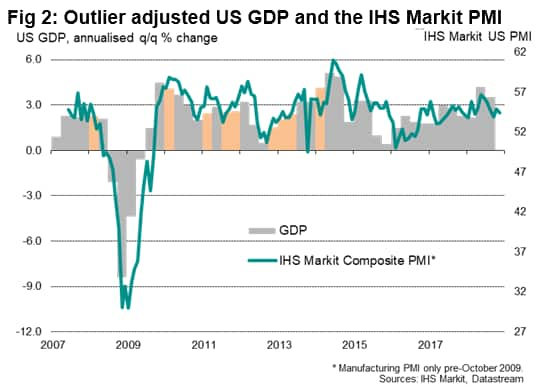
One solution is to take averages of the GDP for the periods around the suspected 'outliers', as shown in Fig 2. This process lifts the correlation of GDP with the PMI from 74% to 86%, therefore improving the model's predictive power for future GDP estimation. The adjusted r-square of the outlier adjusted model is 0.75 against 0.55 without the outliers removed.
Manufacturing resilience
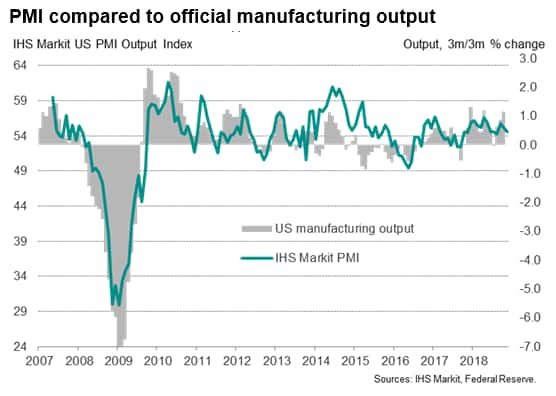
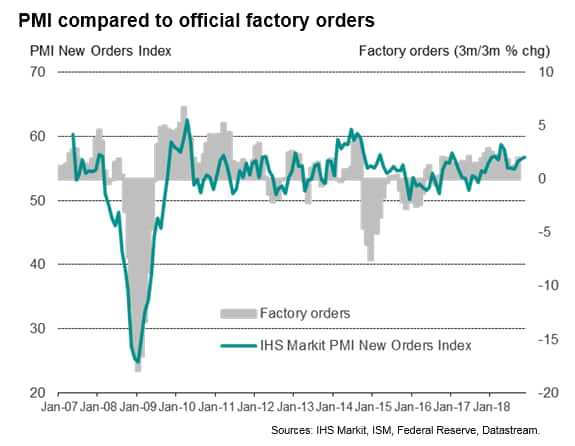
Given the escalating trade conflicts in recent months, it was especially reassuring to see manufacturing growth hold up well in November. The flash survey results showed manufacturing output continuing to rise, increasing at a rate commensurate with the official gauge of output growing at an annualised rate of approximately 1%. While this represents a slowdown from the prior two months, an increase in new order inflows suggest demand remains encouragingly strong. New orders in the manufacturing sector grew at the fastest rate for six months according to the flash survey results. The disparity between slower output growth and increased inflows of new orders could also in part be explained by capacity constraints limiting production growth in the short term.
The manufacturing PMI survey's Output Index and New Orders Index both correlate well with the comparable official manufacturing growth rates, exhibiting correlations of 89% and 76% respectively, in both cases only diverging from official data to any significant degree in 2014-15 (a period when the official data displayed odd volatility).
Upward price pressures
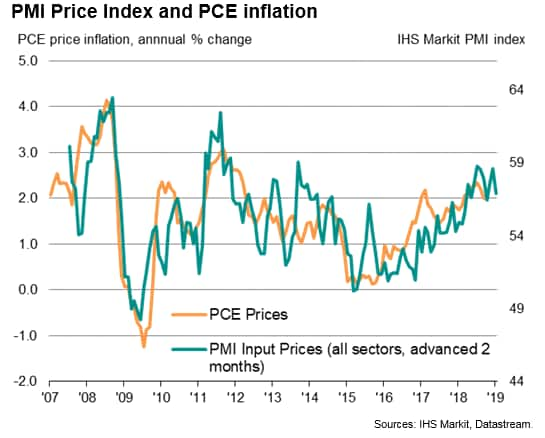
With the economy growing at a solid rate and still generating jobs in strong numbers, it was perhaps not surprising to also see price pressures remaining elevated. At 56.9, the composite Input Price Index from the two sectors slipped to a three-month low, according to the flash November reading, but as our comparison with PCE inflation shows, the current level remains indicative of annual PCE inflation slightly in excess of 2%. Tariffs were again widely blamed on price rises, alongside increasing energy and wage costs.
Chris Williamson, Chief Business Economist, IHS
Markit
Tel: +44 207 260 2329
chris.williamson@ihsmarkit.com
© 2018, IHS Markit Inc. All rights reserved. Reproduction in whole or in part without permission is prohibited.
Purchasing Managers' Index™ (PMI™) data are compiled by IHS Markit for more than 40 economies worldwide. The monthly data are derived from surveys of senior executives at private sector companies, and are available only via subscription. The PMI dataset features a headline number, which indicates the overall health of an economy, and sub-indices, which provide insights into other key economic drivers such as GDP, inflation, exports, capacity utilization, employment and inventories. The PMI data are used by financial and corporate professionals to better understand where economies and markets are headed, and to uncover opportunities.
This article was published by S&P Global Market Intelligence and not by S&P Global Ratings, which is a separately managed division of S&P Global.