New case studies in active PMI™ investment strategies in Japan and the US

In this paper we present ideas on how to derive signals from national sector PMI data and use these in active equity investment strategies for both Japan and the US.
Following on from our previous papers, our analysis is again based on an investment approach that a) derives sector signals from the perspectives of momentum and relative performance and b) uses a naïve strategy where funds are invested into those categories with the strongest signals.
Results are once again positive, with signals from the PMI data generating excess returns compared to a naïve benchmark strategy in a coherent and consistent fashion.
The paper proceeds as follows.
Sections 1 and 2 provide the background to the PMI datasets and the methodology that we employ. Readers already familiar with our earlier work are welcome to skip these two sections, though may find them useful as a refresher.
Section 3 looks at the modelling performance of both US and Japanese national sector PMIs. Section 4 summarises.
1. Background
Available for the world's largest developed and emerging economies, Purchasing Managers' Index™ (PMI™) surveys for the manufacturing, services and construction sectors are widely viewed by economists, policymakers, and financial market participants as key benchmark indicators of economic conditions.
The data are derived from questionnaires sent to senior company decision-makers, with respondents asked to state whether variables such as output, orders, prices, and inventories have improved, deteriorated, or stayed the same compared with the previous month.
From the aggregate results of these questionnaires, so-called diffusion indexes are then calculated for each variable (the percentage of positive responses plus half the percentage of neutral responses). These indexes vary between 0 and 100 with levels of 50.0 signalling no change on the previous month. Readings above 50.0 signal an improvement or increase on the previous month. Readings below 50.0 signal a deterioration or decrease on the previous month. The greater the divergence from 50.0 the greater the rate of change signalled.
Given the extensive global coverage of our national PMIs - over 28,000 companies are polled each month across more than 40 countries - IHS Markit has in recent years created broad sector PMI data for four regions: Global, Europe, Asia, and the US.
However, further interrogation of the datasets has recently led to the development of new sector PMI indices for constituent European, Asian, and emerging market (EM) nations - as well as more granular US sectors.
Derived from IHS Markit's national PMI survey panel data, these sectors are structured according to legacy Markit Sector classifications, a 5-tier structure based on stock market sectors and covering 3 out of 5 tiers (Tiers 2-4).
The datasets can create insight into sector profitability and offer tools for investment strategy and asset allocation by providing monthly indicators of business trends across variables such as output, order books, prices, inventories, and employment for eight major industry groups including:
- Basic Materials
- Consumer Goods
- Consumer Services
- Financials
- Healthcare
- Industrials
- Technology
- Telecommunication Services
A wide range of detailed sectors and subsectors of those groups is also available.
2. Methodological Approach
Rather than taking a typical approach that uses pure diffusion index data to compare sector performance, an alternative - and in some respects more intuitive - method based on a simple PMI z-scoring system can be employed.
Assume that we decide to use a single PMI index to score the relative performance of a sector, and that performance is defined as the one-month change in the index. This focus on the one-month change is important as it allows us to measure relative sector performance from the perspective of momentum.
Indeed, consider an individual sector i for a time-period, t, with this change in the index value compared against the average change across all sectors i = (1, 2, … N) during time-period, t.
Dividing this difference by the standard deviation of all sector changes will subsequently provide a z-score for sector i as shown in the equation below:

Repeating this process for N sectors provides the basis for comparison: those sectors with the higher z-scores will have the strongest momentum and as such could be viewed as having a 'buy' signal.
However, rather than using a single index to gauge sector momentum, a range of PMI sub-index data and various transformations to these sub-indices may be preferable.
For instance, a modeller may wish to take a view of both short-term data trends - such as changes in order books, current pricing power etc - but also look at slightly longer-term influences on future financial performance such as capacity constraints.
This approach allows the modeller to then build up a much more rounded, holistic view of sector health and relative momentum compared to just using a single index.
3. Case Studies: US and Japan
Having successfully employed these methods with EU data, we chose to further test our theories with national PMI data for two of the world's largest economies: Japan and the United States.
We again sought intuitive derived barometers of company financial health from the PMI datasets, armed with the belief that these would have the greatest potential for creating positive investment signals. These include:
- Three-monthly change in output prices (pricing power)
- Difference between three-monthly changes in output prices and input costs (margins)
- Three-monthly change in new orders (demand growth)
- Difference between latest backlogs of work index and 12-month average (capacity constraints).
- Difference between latest output charges index and 12-month average (historical pricing power)
To stress, given the range of data that are available, there are many permutations with regard to combinations of transformations and sub-indices that could be deployed.
Nonetheless, with a hypothesis that high z-scores should encourage higher returns for a particular sector, we separately downloaded individual company equity data from Refinitiv for both Japan and the US.
We then equally weighted market return proxies that broadly matched up with eleven 'tier 3' national PMI sectors for the US and six 'tier 2' PMI sectors for Japan.
Analysis covered the period since 2011 for the United States and since 2009 for Japan (these starting dates simply reflect differences in data availability for the respective nations).
We again assume that investors would initiate any changes to their portfolios within a day of receiving PMI data from IHS Markit. Based on historical release dates - that are readily available to users of the data - we generated a time series of returns for each sub-sector for holding periods of one-, three- and six- months respectively.
To test our hypothesis that higher z-scores are associated with 'buy' signals, a simple approach to investment strategy was considered: for any positive signal for PMI sector(s) - defined as z-scores > 1 - then our portfolio would be fully tilted towards those sector(s).
Performance of our strategy is measured against a baseline model that simply weights a portfolio across all sectors where we seek to a) generate excess returns and b) consistently succeed on a 'per event' basis.
That is, out of the times (or events) that we observed 'buy' signals for specific sectors, how often in percentage times did this strategy outperform the passive, equal-weighted approach?
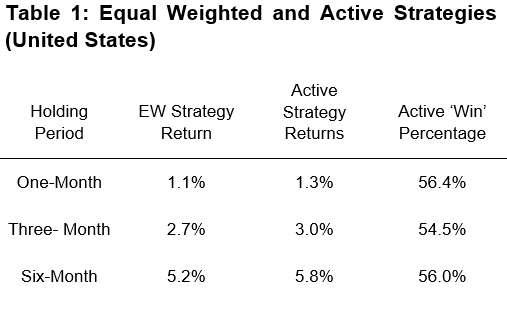
a) United States
When analysing the potential of different strategies in creating investment signals across US equities markets, we tried several weighting combinations and found that charges and margins data had strong short-term influences in generating positive excess returns.
Indeed, the following mix margins (60%), charges (20%) and input prices (20%) worked particularly well. When compared against the benchmark of an equally weighted combination across all tested sectors, our active investment strategy was able to generate excess returns over the one-month, three-month and six-month holding periods (see table 1).
Moreover, this active strategy garnered excess returns when compared to an equal weighting combination in well over half of the monthly 'events' that were observed during our ten-year analysis period1.
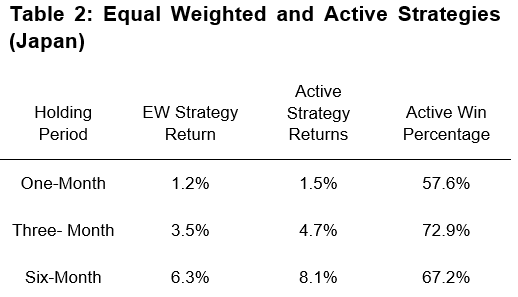
b) Japan
Using the active strategy across a sample of Japanese equities since January 2009, in contrast to the US we found that both new orders and backlogs data were especially strong indicators for generating excess returns.
Using a weighted combination of the new orders (75%) and backlogs (25%) measures described in the methodology section, our strategy generated superior returns for one-month, three-month and six-month holding periods.
Moreover, in each month that PMI data provided a signal for active investment, the active strategy outperformed the equal weighted strategy well over 50% of the time, with the results for a three-month holding period being particularly impressive2.
4. Summary
Revisiting previous work on European PMI data, we have extended our ideas on how best to utilise national sector PMI data in active investment strategies to two major global economies, namely Japan and the United States.
Our analysis is again rooted in the belief that PMI sub-index data can be transformed and combined to provide holistic overviews of sector performance. These 'momentum' signals can then be used to generate excess returns in a consistent manner when compared to a simple passive strategy.
We would again stress that the degree of success will be sensitive to the weighting and variable combinations employed and, of course, the period of analysis that is being tested. It is interesting to note, for instance, that the success of US strategies was linked closely to developments in PMI price variables, but for Japan, order book and backlogs data were relatively more important.
Overall, we hope that the results provide a suitable baseline for investors to further test and consider the potential of the national sector PMI data in their strategies and research.
IHS Markit Sector PMI indices are currently available for the constituent European, Asian, and emerging market (EM) nations, plus the US, and trials of the data are available for interested users.
Further information and details can be provided by emailing economics@ihsmarkit.com
1 Out of the 120 months that covered our US analysis, there were 75 months or 'events' where the active investment strategy was enacted.
2 For Japanese data, of over 140 months of data analysis, there were just under 60 occurrences when the active investment strategy was used.
Paul Smith, Economics Director, IHS Markit
Tel: +44 (0) 1491 461038
paul.smith@ihsmarkit.com
Siân Jones, Senior Economist, IHS Markit
Tel: +44 1491 461017
sian.jones@ihsmarkit.com
Eliot Kerr, Economist, IHS Markit
Tel: +44 (0) 203 1593 381
eliot.kerr@ihsmarkit.com
© 2021, IHS Markit Inc. All rights reserved. Reproduction in whole
or in part without permission is prohibited.
Purchasing Managers' Index™ (PMI™) data are compiled by IHS Markit for more than 40 economies worldwide. The monthly data are derived from surveys of senior executives at private sector companies, and are available only via subscription. The PMI dataset features a headline number, which indicates the overall health of an economy, and sub-indices, which provide insights into other key economic drivers such as GDP, inflation, exports, capacity utilization, employment and inventories. The PMI data are used by financial and corporate professionals to better understand where economies and markets are headed, and to uncover opportunities.
This article was published by S&P Global Market Intelligence and not by S&P Global Ratings, which is a separately managed division of S&P Global.